
Every morning, yesterday's sales from every channel, without touching a spreadsheet.
Department stores, own stores, wholesale: each channel sends sales in its own format. The tool reads them, checks them and shows you every morning how each store and point of sale is performing, compared day by day with last year.
Yesterday's sales · Friday 10 October
| Channel | Units | Revenue | vs. Fri 11/10/25 |
|---|---|---|---|
| Department stores · 14 corners | 312 | 24.960 € | +6,8 % |
| Own stores · 6 | 148 | 13.690 € | +2,1 % |
| Wholesale | 96 | 6.240 € | −4,5 % |
| Total | 556 | 44.890 € | +3,9 % |
Compared with the same weekday last year, not the same date.

The photographs on this page are generated with AI.
From each channel's file to each morning's report
Four things someone does by hand today, every week, that start happening on their own.

Each channel with its own file
Excel or CSV, whatever the columns: the tool recognises the file, checks it against its own totals and loads it. Reloading a corrected day replaces it; nothing is duplicated. Files that arrive by email or into a folder load on their own.
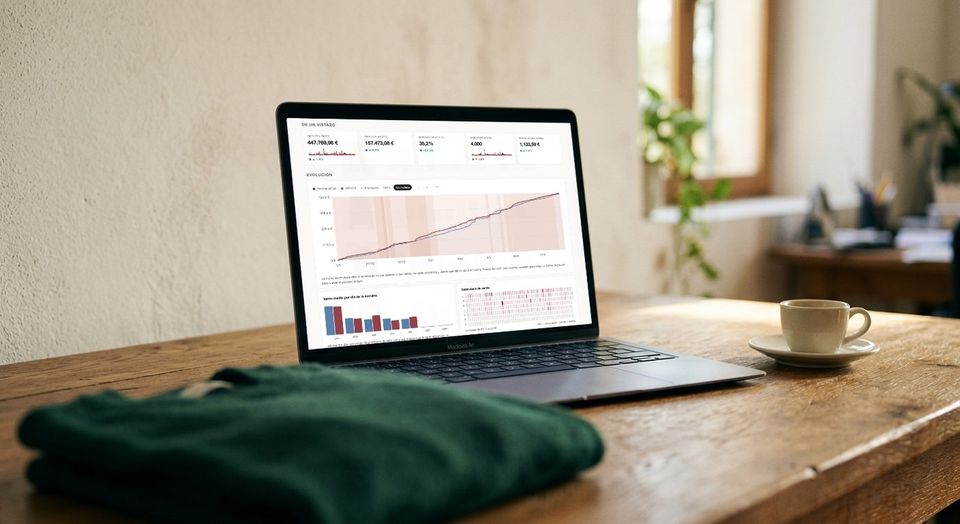
Summary and analysis, with the style photo
By channel, store, family, style and colour, with the photo next to the code. Each day is compared with the same weekday a year earlier, and each season with the previous one over the same dates. Best sellers and slowest movers, with the colour breakdown.

The reports you already build, calculated for you
The monthly tracking sheet someone fills in by hand, the sales comparison by store, the week's returns: reproduced with the same numbers and the same layout, and from then on they come out by themselves.

By email, at the time you choose
Every report, as a PDF, to whoever should get it: daily, weekdays, weekly or monthly. Anyone on several reports gets a single email. On Monday at 8 the whole week is in the inbox.
Everyone sees what they should

Everyone, their own figures
A sales rep or area manager can follow their points of sale in units, without seeing revenue or margin. Management sees everything.
By channel and by point of sale
Each person sees every channel and point of sale or only the ones they manage, on every screen and in every report.
A record of every load
Who loaded what, when and with what result. A wrong load is undone with one click.
Your data, yours alone
Each brand has its own installation, with its own database and files.
Every new collection starts from what has already sold
Before proposing a single piece, the studio looks at previous seasons' sales. The brand's judgement and the store's numbers, on the same table, from the first sketch.
- What sellsFamilies, shapes and colours that sold well at full price carry weight in the proposal again.
- What comes backPieces that come back too often are flagged, with the reason, before anyone draws them again.
- What pays offWhat sells only on markdown, or does not pay off, is flagged. You decide whether to push on.
The studio does not propose what does not work again unless you ask.



How it works
No two brands are alike, and neither are their prices. A tailored quote, with no surprises, based on the channels you have and the reports you want to see each morning.
Set-up, with you alongside
We do not leave you alone with a new tool. We prepare your installation, teach it to read each channel's files, load the history and reproduce the reports you already use, until the first morning they arrive on their own. One fixed fee, agreed before we start.
One monthly fee, and that is it
Hosting, backups, maintenance and improvements are all in the fee. And every month includes hours for the small things that come up along the way: a tweak, a question, a last-minute change. No surprise invoices.
AI spend always under control
The AI works only when you ask it to, and every image or proposal is logged with who asked for it and what it cost. You can see the month's spend at any time, by person and by feature, and decide how far to go. Never a surprise at the end of the month.
Custom work, whenever you need it
Your brand has its own way of working, and the tool adapts to it: a new report, a sheet with your fields, a screen only you need. We quote it by the hour, explain every job in a detailed report, and what we build for you stays in your installation.
Show us a sales file
With a sample file from one of your channels we can show you your own numbers inside the tool. Write to:
hola@iaipunt.com